Vector Analysis
1.0 Overview
Analysis is often considered to be "the heart" of GIS. Through analysis new information is gained. As a GIS stores both attribute and spatial data, analysis can be conducted on both types of data – however, it is the spatial analysis capability that sets GIS apart from database applications.
There are a great many GIS
analyses that can be conducted. For convenience sake we often group the
analyses into categories. For the purpose of this course I have
decided to create a bit of a hierarchy. This is done to reflect your
lab experiences using GIS. Our first encounter with GIS analyses is with vector
data. Later we will (hopefully) move into analysis of raster data. The focus
of this module is vector data. The breakout of vector analysis is as
follows:
Attribute
Attribute Query - Select by Attribute
Arithmetic Calculation
Statistical Summary
Reclassification
Relating Tables
Spatial Join
Spatial
Spatial Query - Select by Location
Spatial Calculation
Spatial Join
Overlay
Buffer
Dissolve
Network Analysis
2.0 Attribute Data Operations
There are many operations that can be conducted on the attribute database (the data tables). These can be divided into 4 categories: query (or logical), arithmetic, statistical and reclass operations. I included a short note about relating tables as it enhances our analytical capabilities. There is also the spatial join function, which straddles attribute and spatial analysis.
2.1 Queries = Select by Attributes
Queries include both comparison (=, >, <, >=, <=, <>) and Boolean (AND, OR and NOT) operators (for a simple but effective visual, check-out the Boolean Machine). These operators are used to perform queries.
Example 1: a simple comparison query,
Forest_Age >= 250 (years)
would query for a subset of forest polygons that could be considered ‘old growth’.
Note the query has 3 parts: field name, operator and value.
Example 2: in Pacific Northwest critical deer winter range has old growth Douglas-fir trees. The query has two criteria and would look like,
Forest_Age >= 250 AND Fir% >= 50.
This second query operates on two attribute fields and is more specific (restrictive) than the first – it would yield a smaller subset of polygons as both conditions would have to be met.
Example 3: if deer simply liked old growth and/or Douglas-fir (a fictitious example), then the query would be
Forest_Age >= 250 OR Fir% >= 50.
This query is more inclusive as a stand can be either old OR composed of Douglas-fir.
2.2 Arithmetic
Arithmetic operators perform simple mathematical functions on values in the attribute database; operators include:
· +
· -
· /
· *
· n (raised to the power of)
· √
· Sin
· Cos
· Tan
These operators can be utilized to to calculate values to be placed in a new field:
|
convert square metres (m2) to hectares (ha) [e.g. divide by 10,000] - results would be placed in a new field in the table | |
|
convert driving distance to driving time [ e.g. divide by average driving speed] - results would be placed in a new field in the table | |
|
determine total volume (m3) [e.g. multiply area (ha) by inventory volume (m3/ha)] - again results would be placed in a new field in the table |
2.3 Statistics
Statistical operations can also be performed on the attribute data. There are 2 options available when you right-click on a field name: 'statistics' and 'summarize'. 'Statistics' provides a temporary pop-up table with the typical parameters:
· count
· minimum
· maximum
· sum
· mean
· standard deviation
Plus the data are plotted in a histogram (frequency distribution).
'Summarize' creates a an output data table. Statistics are based on unique values in a chosen field. selected fields from these operations are placed in a summary table. In the example below, the field Group was chosen and the statistics count, sum and mean were calculated.
Data Table Summary Table
|
Group |
Value |
|
Group |
CountValue |
SumValue |
MeanValue |
|
A |
100 |
|
A |
3 |
700 |
233 |
|
A |
300 |
|
B |
2 |
150 |
75 |
|
C |
50 |
|
C |
1 |
50 |
50 |
|
B |
80 |
|
|
|
|
|
|
B |
70 |
|
|
|
|
|
|
A |
300 |
|
|
|
|
|
2.4 Reclassification
Reclassification is another operation that can be conducted on attribute data. Reclassification results in a generalization (i.e. a simplification) of the original data set. For instance, raw property values in a data set can be put in 3 classes: lower, middle, and upper class. We typically use the legend editor (in ArcGIS the Symbology tab of the Layer Properties dialog box) to classify the data - altering the legend is temporary and we can change the colouring at anytime. (If we want a "permanent reclassification", e.g. a new map, then we would use Merge / Dissolve - this is described in section 3.5 below).
2.5 Table Relations
Relating tables to each other involves joining or linking records between two tables. This may not be considered ‘an operation’, but it does allow us to relate outside source data to our themes to allow the features in our themes to be analyzed based on ‘outside’ data. Refer to the database lecture notes.
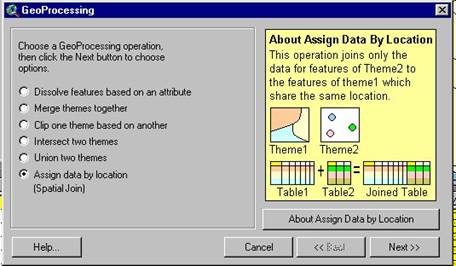
2.6 Spatial Join
As with relating tables, a spatial join will relate records between two tables. But the records are not joined based on a common attribute value (usually ID); instead records are joined based on ‘common location’ (as defined by the coordinates of the spatial features). This type of operation is a combination of spatial and attribute; it is described in more detail in section 3.2 below.
3.0 Spatial/ Geometric Operations
The spatial characteristics of map features (points, lines, polygons) can also be analyzed. Location, size and shape of the map features, as defined by their coordinates, are basis for these operations. Spatial operations can be categorized as follows:
3.1 Spatial Query - Select by Location
This is where features in one theme are selected based on their spatial relation (connectivity, containment, intersection, or nearness) to features in a second theme (i.e. select forest stands that contain an eagle’s nest); new data is not created, just a set of features are selected. A few examples:
|
intersect – share geographic space (roads that cross creeks) | |
|
within a distance of – as the name implies, select features within the “buffer area” (wildlife trees within 20m of river) | |
|
contain – feature has to be within (e.g. select forest stands that contain wildlife trees) |
3.2 Spatial Calculations
Simple spatial calculations determine areas, perimeters,
and distances based on the coordinates (in ArcView these are accessed through
the ‘shape’ field as it contains the vertices); the calculations utilize the
coordinates that define the features, but the results are stored in the database
table (so this operation also straddles both attribute and geometric).
3.3 Spatial Join
As previously stated, this operation is a mix of spatial
and attribute operations. The end result is a join of two database tables, but
the basis for the join is ‘coincident space’. As with a ‘regular join’ the
relation has to be one-to-one or many-to-one between records in the
‘destination-to-source tables’. As an example we could have two themes:
Cities and Countries of the world. A spatial join could be done for
cities as the destination theme, as it yields a many-to-one relation (many
cities to one country). A spatial join would thus bring data from the
Countries theme to the Cities theme. A spatial join could not be
done with Countries as the destination table as the relation would be
one-to-many.
3.4 Overlays – bringing together two themes – the
line work of the two themes are combined (lines
are broken, new nodes and links/arcs are recognized, topology is redone, note
that sliver polygons may have to be eliminated) and the fields from
both theme databases are combined into one new database. Three common
types of overlays:
|
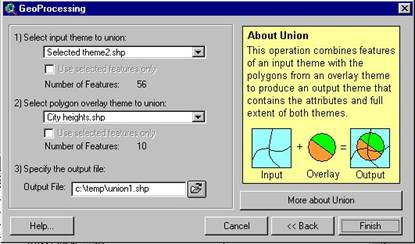
Union – is a complete merging of two themes where
the new theme is composed of the entire map area of both themes and all the
fields from both theme data tables | |
|
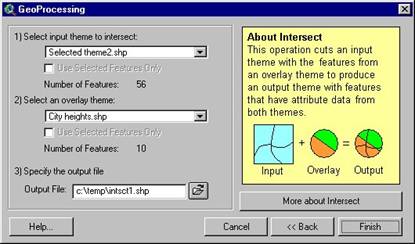
Intersect – is a merging of two themes but only where
they share space such that the ‘map area’ of the new theme is the area
that was in common for both themes and the attribute database is
composed of all the fields from both theme data tables |
|
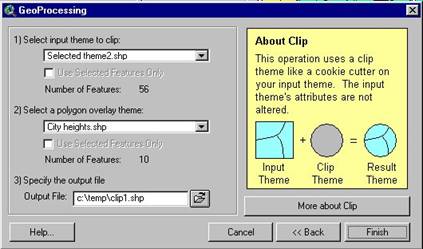
Clip – is akin to pressing a cookie cutter onto a
theme such that the new theme is a miniature version of the first (a
mini-me), the map area is defined by the overlay (cookie cutter) theme and the
database comes only from the input (cookie dough) theme. |

|
Update - features from the 'update layer' descend upon the input theme
and replace whatever was underneath. An example would be updating a
timber type map (input layer) with a cut block (update layer) where the cut
block shape supersedes the timber types it overlaps. | |
|
Erase - the polygons from the 'erase layer' descend upon the input theme and eliminate that area. An example would be if land were expropriated from a woodlot owner to create a park. The 'park area' would be erased from the woodlot area. |
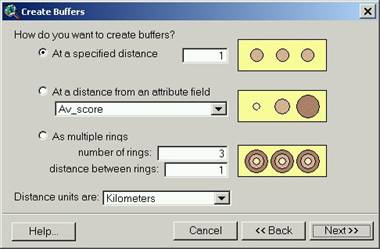
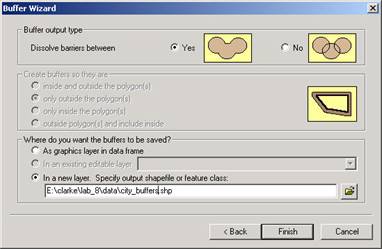
3.5 Buffers
Buffering creates a new theme with new polygon features (geometric objects) based on a constant measure from features in a source theme; buffers around points are circles, around lines are ‘corridors’ (snake-like with rounded ends) and around polygons are ‘donuts’; buffers can be created based on:
|
a single set width (i.e. all features by 50m) |
|
multiple widths where more than one buffer is created around each feature (i.e. a 50 and a 150m buffer created around each feature – gives a “bull’s eye” effect) |
|
varying width based on an attribute field (i.e. width
for each feature is stored in the data table, buffer width depends on the
value in this field) |
|
other factors include:
|
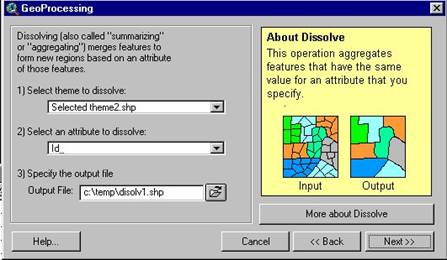
3.6 Dissolve
With dissolve, also known as merge polygons, boundaries
between adjacent polygons with the same attribute value (i.e. class = poor) are
‘dissolved’ and the two (or more) polygons are merged into one larger polygon; a
new map layer (theme) results with the generalized data. This is the ‘spatial equivalent’
to reclassification of attribute data.
3.7 Network Routing – as the name implies, this type of analysis assesses movement through a network. Consider the difference between the shortest route and the fastest route. During the middle of the night the ‘shortest route’ is likely the ‘fastest route’, however, during rush hour I would consider traffic and use the ‘fastest route’ (which may have a longer distance). The network is modeled using lines (arcs) and intersections (nodes). Arc-node topology provides information regarding connectivity. The attribute database would provide additional information regarding impedance to flow (or movement). Examples would include speed limit and traffic loads at different times of the day. There is a ‘cost’ to making turns at intersections – i.e. you have to slow down rather than use just two wheels to make the turn. One-way streets would provide for an absolute barrier. As well, making a turn off of an overpass onto a highway below would be prohibited. Other routing examples include most efficient route (for making several stops or deliveries) and location-allocation (where school catchment areas can be determined based on road network and not just a straight-line distance).
Note the difference between the two routes.
3.8 Summary
The results of these spatial operations take on different forms: item 3.1 is a spatial query and merely results in a selection of map features that meet the ‘spatial criteria/relation’, items 3.2 and 3.3 result in additions/changes to the database tables, items 3.4 - 3.6 generally result in a new theme with line work and a data table based on the spatial operation, and . Item 3.7 (networks) usually result in a selection of lines within the network that represent the best route.